Coverage Plots
Ease the use of the neat coverage plots from deeptools.
- CoveragePlots.plotHeatmap(beds_to_plot, bed_labels, bigwigs, bw_labels, out_dir, out_tag, mode, perGroup=True, title='', scaled_size=1000, start_label='TSS', end_label='TES', referencePoint='center', vmin='auto', vmax='auto', upstream=200, downstream=200, n_cores=1, cmap='plasma', legend_loc='best', show='plot, heatmap and colorbar')
Wrapper function that combines the computeMatrix and plotHeatmap function from deeptools to create coverage plots (https://deeptools.readthedocs.io/en/develop/content/tools/plotHeatmap.html). Requires the deeptools’ functions to be available on PATH.
- Parameters:
beds_to_plot – List of either BedTool objects or the paths to bed-file. Note that if strand is a relevant information, it should be in the 6th column (1-based).
bed_labels – List of labels for the bed files, have to have the same order.
bigwigs – List of bigwig files.
bw_labels – Labels for the bigwig files, have to have the same order.
out_dir – Path to write the intermediary files, including bedtool’s objects and plots to. Should be a directory.
out_tag – Tag to label the output plots.
mode – Either ‘scale’ or ‘reference’, ‘scale’ rescales different regions to the same size, while ‘reference’ extends from one position of the regions.
perGroup – If True plot the coverage of the bigwig files underneath another in one column instead of making a column for each bigwig file.
scaled_size – For ‘scale’ mode to what size the regions should be scaled to.
start_label – For ‘scale’ mode how to label the start position.
end_label – Same as above but for the end.
referencePoint – From where to extend the regions in the ‘reference’ mode: ‘TSS’ for region start, ‘TES’ for region end or ‘center’.
vmin – Minimum value for the heatmap. The curves are unaffected by this.
vmax – Maximum value for the heatmap.
upstream – How far to extend the regions upstream in ‘reference’ mode.
downstream – How far to extend the regions downstream in ‘reference’ mode.
n_cores – Number of cores to compute the matrix that’s then used for plotting.
cmap – Colormap used for the visualising the signal.
legend_loc – best, upper-right, upper-left, upper-center, lower-left, lower-right, lower-center, center, center-left, center-right, none.
show – Which parts of the plot to generate: plot, heatmap and colorbar; plot and heatmap; heatmap only; heatmap and colorbar
from pybedtools import BedTool
import CoveragePlots
out_dir = 'docs/gallery/'
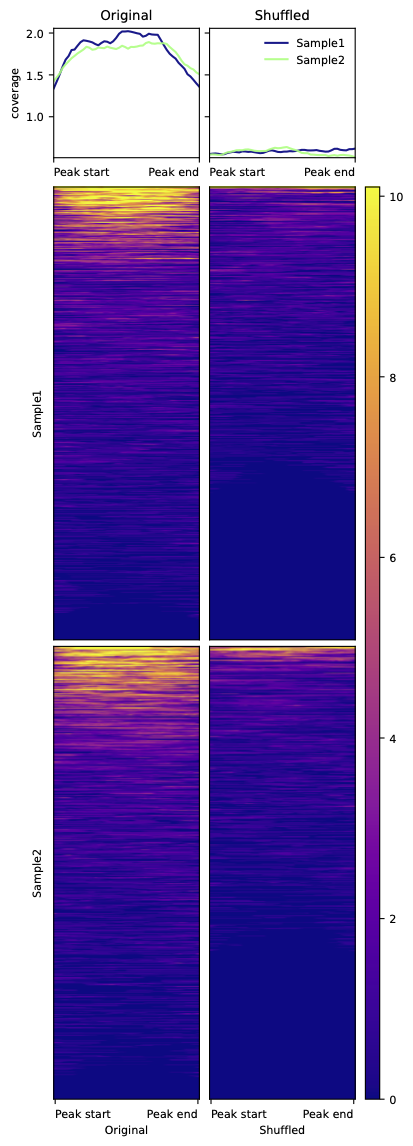
# Let's plot the signal of two bigwig files from IHEC (https://ihec-epigenomes.org/epiatlas/data/) in a small set of peaks and compare that to the signal in their shuffled locations.
peaks = BedTool("ExampleData/H3K27acPeaks_chr21.narrowPeak")
shuffled_peaks = peaks.shuffle(genome='hg38', chrom=True, seed=12)
bigwigs = ['ExampleData/IHECRE00000013_chr21.bigwig', 'ExampleData/IHECRE00000017_chr21.bigwig']
CoveragePlots.plotHeatmap(beds_to_plot=[peaks, shuffled_peaks], bed_labels=['Original', 'Shuffled'], bigwigs=bigwigs, bw_labels=['Sample1', 'Sample2'],
out_dir=out_dir, out_tag='ExampleCoveragePlot', mode='scale', perGroup=True, title='',
scaled_size=500, start_label='Peak start', end_label='Peak end')